Microarray Analysis From Research to Industry: GEO & ArrayExpress

Picture a pharmaceutical company racing to develop a life-saving cancer drug. Deep in their research labs, scientists are analyzing thousands of gene expression patterns, searching for that one molecular signature that could predict treatment success. The technology powering this breakthrough? Often, it's the same microarray platforms that have been quietly revolutionizing medicine for decades.
Why Microarrays Still Rule the Game
From 2024, so, everyone talks about RNA-Seq as the shiny new technology, microarrays continue to be the workhorses of genomics research.
Why?
Think of it this way: RNA-Seq is like having a high-end DSLR camera with endless settings and capabilities, while microarrays are like a perfectly tuned point-and-shoot camera that delivers consistent, reliable results every time.
The numbers tell the story. Major pharmaceutical companies still rely heavily on microarray platforms because they offer something RNA-Seq struggles with: standardization and cost-effectiveness at scale. When you need to analyze thousands of samples for biomarker discovery or drug screening, microarrays provide the perfect balance of information depth and economic feasibility.
RNA-Seq excels at discovering new transcripts and splice variants, but microarrays shine when you know what you're looking for. They're like having a specialized team of detectives who are experts at finding specific clues, rather than generalists who might get distracted by every piece of evidence at a crime scene.
If you’d like a clearer understanding of GEO, microarrays, and how they differ from RNA-Seq—and why they still matter—check out our introductory guide: Microarray Analysis Made Simple: GEO, ArrayExpress & When to Use Each
The Data Goldmines: GEO and ArrayExpress
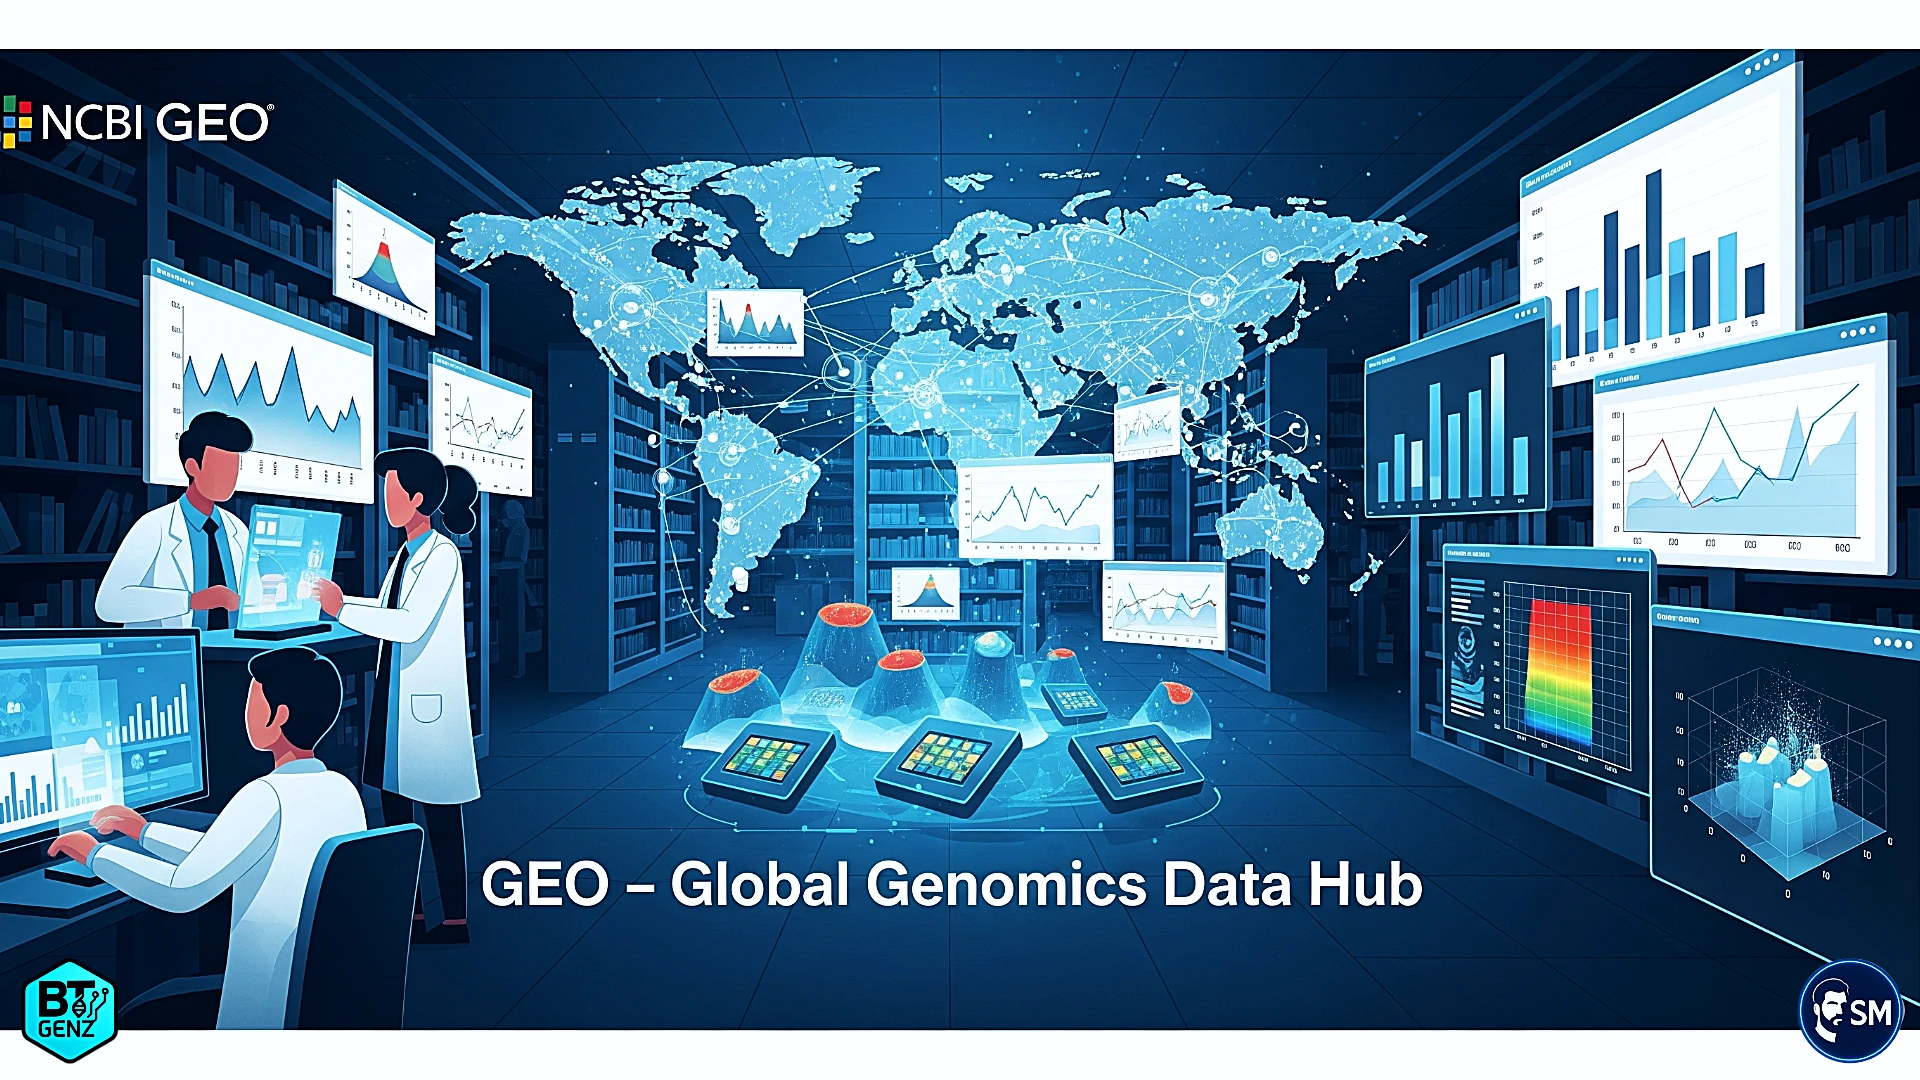
Gene Expression Omnibus (GEO): America's Genomic Library
GEO houses over one million gene expression samples from researchers worldwide. It's organized like a massive digital library where every "book" is a complete genomics experiment [1]. When you search for "breast cancer microarray," you're not just finding data – you're accessing years of carefully conducted research from leading institutions.
Each GEO dataset tells a complete story. Take GSE45827, a breast cancer study comparing tumor samples to normal tissue. The dataset page reveals everything: which microarray platform was used (Affymetrix Human Genome U133 Plus 2.0), how many samples were analyzed (130 breast cancer, 11 normal), and what the researchers discovered — it's like getting the complete experimental recipe, not just the final dish [2].
The beauty of GEO lies in its standardization. Every dataset follows consistent, MIAME-compliant metadata structures and record types (DataSets, Profiles), making it easier to compare studies across laboratories and over time. This consistency is a big reason GEO is the go-to resource for meta-analyses and large-scale comparative studies [3].
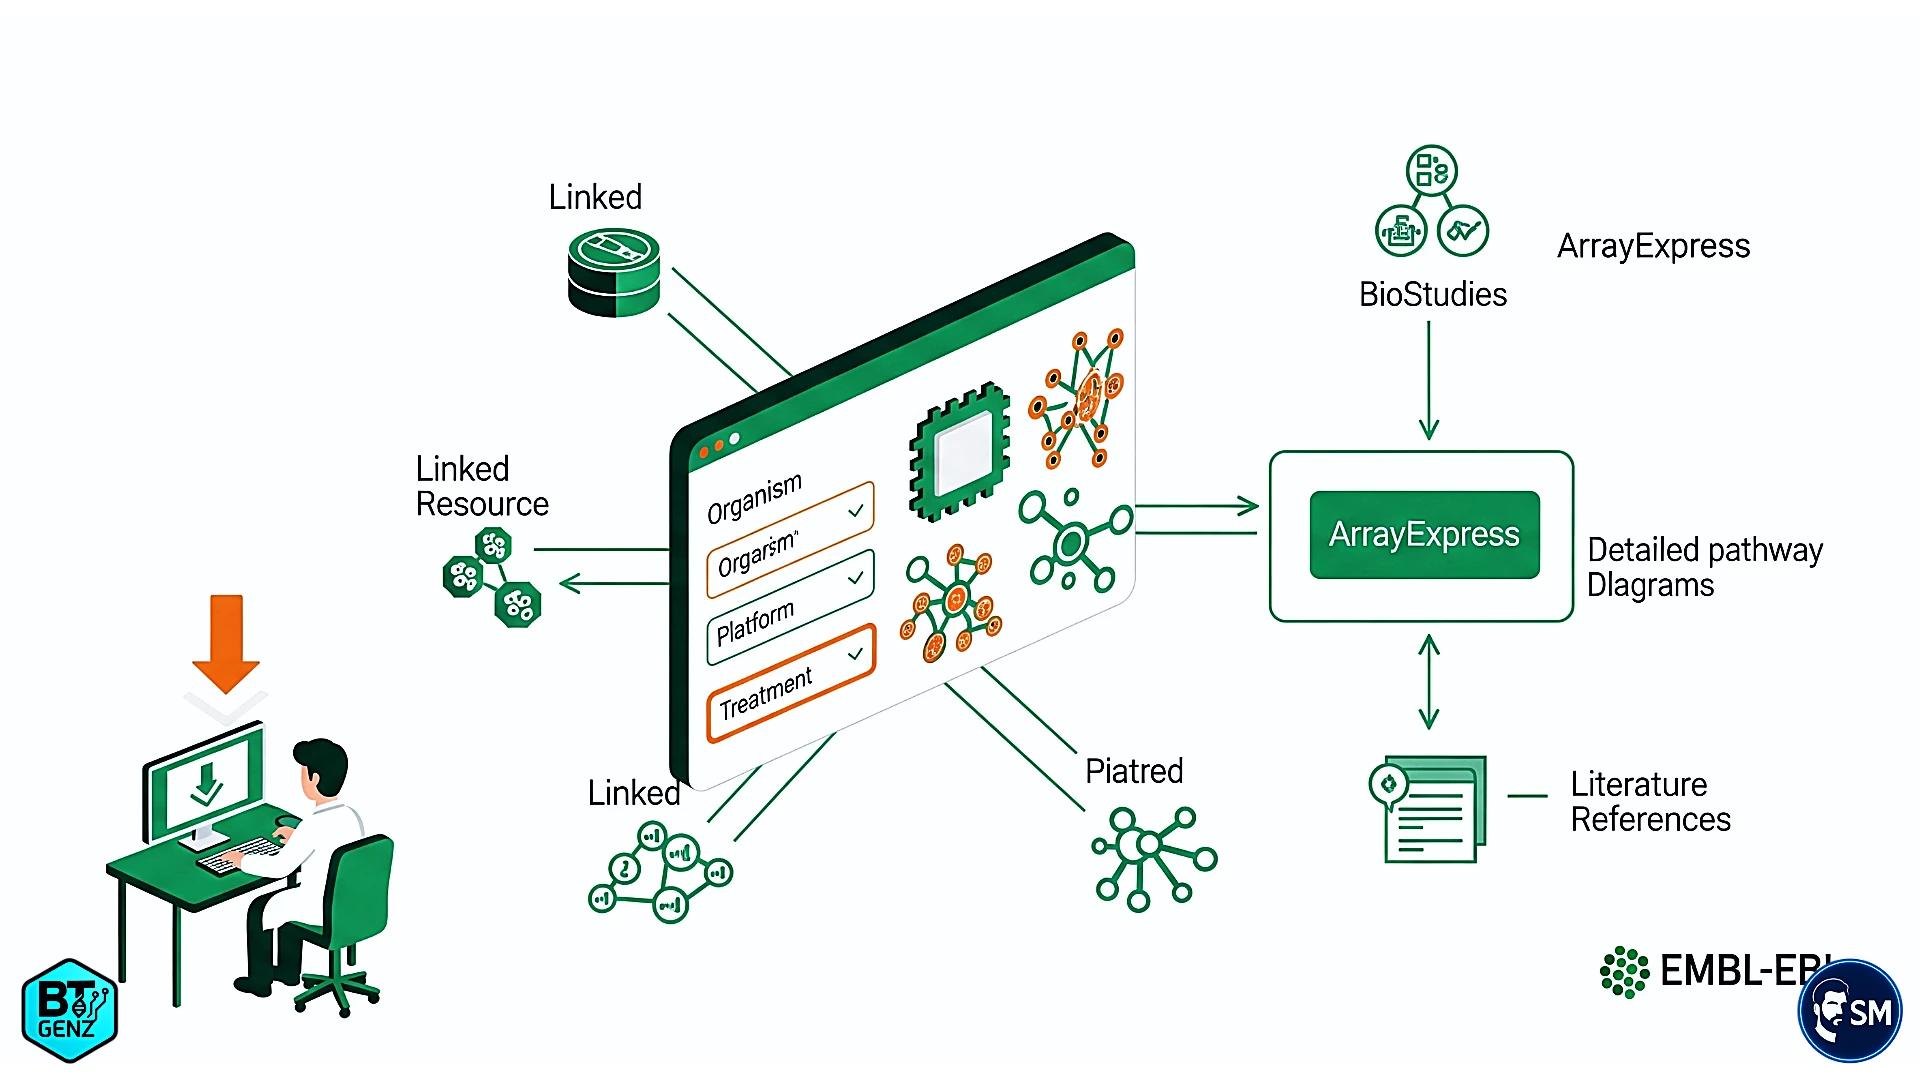
ArrayExpress: Europe's Comprehensive Archive
ArrayExpress complements GEO with its unique strengths. While GEO focuses primarily on gene expression datasets, ArrayExpress—hosted by EMBL-EBI—has evolved into a broad functional genomics repository. Users enjoy advanced search filters that let them query by experimental design, platform type, or specific sample treatments.[4]
What sets ArrayExpress apart is its integration with the broader EMBL-EBI ecosystem. Downloading data from ArrayExpress gives you more than expression values—you gain access to rich metadata, standardized annotations, connections to protein databases, pathway information, and relevant literature. It feels like receiving a complete user manual alongside the dataset.[5]
The platform’s connection to BioStudies enables access to deep experimental context, including detailed protocols, reagent lists, and even raw image files from the original microarray scans.[5]
How Industry Giants Leverage Microarray Technology
Pharmaceutical Powerhouses
Companies like Roche and Pfizer have built entire drug discovery pipelines around microarray data. When developing targeted cancer therapies, they use expression profiling to identify patient populations most likely to respond to treatment. This isn't just academic research – it's the foundation of precision medicine.
Illumina, despite being famous for sequencing technology, continues to innovate in the microarray space. Their BeadArray technology powers everything from agricultural genomics to clinical diagnostics. The company's success demonstrates that microarrays aren't being replaced by sequencing – they're evolving alongside it.
Diagnostic Revolution
Companies like Agilent Technologies have transformed microarrays from research tools into clinical diagnostic platforms. Their SurePrint arrays are used in hospitals worldwide to diagnose genetic disorders, classify cancer subtypes, and predict treatment responses. When a doctor tells a cancer patient about their tumor's molecular profile, there's a good chance that information came from a microarray analysis.
The diagnostic applications extend beyond human health. Agricultural companies use microarray data to develop drought-resistant crops, while environmental monitoring firms use expression profiling to assess ecosystem health. The technology has become an invisible but indispensable infrastructure for modern biotechnology.
Your Toolkit: Beginner-Friendly Analysis Platforms
The barrier to microarray analysis has never been lower. Today's web-based tools put sophisticated genomics analysis within reach of anyone with a web browser and curiosity about gene expression.
ArrayAnalysis.org: Your Web-Based Laboratory
This platform transforms your browser into a complete microarray analysis suite. Upload raw Affymetrix or Illumina data, and ArrayAnalysis.org handles everything from quality control to advanced statistical analysis. It's like having a team of bioinformaticians working in the cloud, accessible 24/7 from anywhere in the world.
The platform's strength lies in its automated workflows. New users often struggle with the hundreds of decisions required for proper microarray analysis – which normalization method to use, how to handle batch effects, which statistical tests to apply. ArrayAnalysis.org makes intelligent defaults while still allowing customization for advanced users.
Genealyzer: Intuitive Gene Expression Analysis
Genealyzer bridges the gap between simple online calculators and complex programming environments. Its drag-and-drop interface makes differential expression analysis feel like organizing photos on your computer. Select your control samples, choose your treatment groups, click analyze, and watch as the platform generates publication-ready visualizations.
The platform excels at Gene Ontology enrichment analysis, automatically connecting your differentially expressed genes to biological processes, molecular functions, and cellular components. It's like having a molecular biology textbook that automatically highlights the relevant chapters based on your data.
BART: Plug-and-Play Analysis
BART (Binding Analysis for Regulation of Transcription) represents the future of accessible bioinformatics. Simply provide a GEO accession number or upload your files, and BART delivers complete differential expression results with professional-quality plots. No installation required, no coding knowledge needed, no complex parameter tuning – just results.
The tool's automated approach makes it perfect for researchers who want to focus on biological interpretation rather than computational details. It's designed around the principle that sophisticated analysis should be simple to execute.
Step-by-Step: Your First Microarray Analysis with GEO2R
Let's walk through a complete analysis using GEO's built-in analysis tool. We'll analyze a breast cancer dataset to identify genes that are differentially expressed between tumor and normal tissue.
Finding Your Dataset
Start at the GEO homepage and search for "breast cancer microarray." Look for datasets with clear experimental designs and adequate sample sizes. GSE45827 provides an excellent example – it contains 130 tumor samples and 11 normal controls, perfect for differential expression analysis.
Click on the dataset link to access the detailed information page. Here you'll find the experimental design, sample descriptions, and platform information. This metadata is crucial for understanding what comparisons are meaningful and how to interpret your results.
Launching GEO2R
Every GEO dataset includes a "GEO2R" link that launches the integrated analysis tool. GEO2R is essentially a web-based interface to R's powerful limma package, making advanced statistical analysis accessible without programming knowledge.
The interface presents your samples in a spreadsheet-like format. Each row represents a sample, with columns showing sample names, characteristics, and experimental conditions. This is where you'll define your comparison groups.
Defining Your Analysis
The key step is grouping your samples into meaningful comparisons. For our breast cancer example, create two groups: "Normal" (containing the 11 control samples) and "Tumor" (containing the 130 cancer samples). GEO2R color-codes your groups, making it easy to verify you've selected the right samples.
Pay attention to potential confounding factors. If samples were collected at different times, processed by different technicians, or came from different institutions, these batch effects could influence your results more than the biological differences you're trying to measure.
Running the Analysis
With groups defined, click "Top 250" to identify the most significantly differentially expressed genes. GEO2R performs sophisticated statistical analysis behind the scenes, calculating fold changes, p-values, and false discovery rates for thousands of genes simultaneously.
The results appear as a sortable table showing gene symbols, fold changes, and statistical significance measures. Genes at the top of the list show the strongest evidence for differential expression between your groups.
Interpreting Your Results
Look for genes with both large fold changes (typically >2-fold up or down) and high statistical significance (adjusted p-value < 0.05). These represent your most confident findings – genes that are both biologically meaningful and statistically robust.
The fold change tells you the magnitude of difference, while the p-value tells you the confidence level. A gene that's upregulated 10-fold with p < 0.001 is a much stronger candidate than one that's upregulated 1.5-fold with p = 0.04.
The Universal Workflow: Industry Standard Approach
Every professional microarray analysis follows the same fundamental workflow, whether conducted at a pharmaceutical company, academic institution, or diagnostic laboratory. Understanding this workflow helps you think like a professional genomics researcher.
Quality Control: The Foundation of Good Science
Before analyzing any microarray data, professionals spend significant time on quality assessment. This involves checking for failed samples, identifying outliers, and assessing technical factors that might confound biological conclusions. Tools like arrayQualityMetrics in R provide comprehensive quality reports, but web-based platforms increasingly build these checks into their automated workflows.
Poor quality samples can dominate your statistical analysis, leading to false discoveries or missed biological insights. Professional laboratories typically exclude samples that fail quality metrics, even if it means reducing statistical power.
Normalization: Making Data Comparable
Raw microarray data varies due to technical factors – different scanner settings, ambient temperature during hybridization, variations in reagent batches. Normalization methods like RMA (Robust Multi-array Average) adjust for these technical differences while preserving biological variation.
The choice of normalization method can significantly impact your results. RMA works well for most Affymetrix data, while quantile normalization is often preferred for Illumina arrays. Professional bioinformaticians often compare multiple normalization approaches to ensure their conclusions are robust.
Statistical Analysis: Finding the Signal in the Noise
Modern microarray analysis goes far beyond simple t-tests. Professional workflows use sophisticated methods like linear modeling (limma package) that can handle complex experimental designs, multiple factors, and batch effects simultaneously. These approaches provide more accurate p-values and better control of false discovery rates.
The key insight is that analyzing thousands of genes simultaneously requires different statistical approaches than analyzing single measurements. Professional genomics workflows always include multiple testing corrections to avoid false discoveries.
Functional Interpretation: Connecting Genes to Biology
Individual gene lists are just the beginning. Professional analysis always includes functional enrichment analysis to identify biological pathways, gene ontology terms, and molecular networks that are affected by your experimental conditions. This step transforms gene lists into biological insights.
Tools like DAVID, STRING, and Ingenuity Pathway Analysis help researchers understand the broader biological context of their findings. The goal is always to move from "these genes are differentially expressed" to "these biological processes are affected."
Professional Tips for Success
Start with Quality Data
Not all public datasets are suitable for analysis. Look for experiments with clear descriptions, adequate sample sizes, and appropriate controls. Datasets with missing metadata or unclear experimental designs often lead to ambiguous results, no matter how sophisticated your analysis.
Professional researchers always read the original publication associated with a dataset. This provides crucial context about the experimental conditions, sample preparation methods, and known limitations that might affect your analysis.
Validate Everything
In professional settings, microarray findings are always validated using independent methods. This might involve quantitative PCR for individual genes, analysis of independent datasets, or literature searches to confirm biological plausibility.
The most successful researchers develop a healthy skepticism about their results. If a finding seems too good to be true, it probably requires additional validation before being trusted.
Document Your Process
Professional bioinformatics always involves detailed documentation of analysis steps, parameter choices, and software versions. This enables reproducibility and helps collaborators understand and build upon your work.
Even when using point-and-click tools, keep notes about your analysis choices. Future you will thank present you for this attention to detail.
Building Your Career with Microarray Skills
Understanding microarray analysis opens doors in multiple industries. Pharmaceutical companies need researchers who can interpret gene expression data for drug discovery. Diagnostic companies require specialists who can develop and validate expression-based tests. Agricultural biotechnology firms seek experts in crop genomics and stress response profiling.
The skills you develop with microarray analysis – statistical thinking, data visualization, biological interpretation – transfer directly to other genomics technologies. Many RNA-Seq analysis approaches build directly on concepts developed for microarrays.
More importantly, demonstrating practical experience with real datasets shows potential employers that you can work with messy, real-world data and extract meaningful biological insights. This practical experience often matters more than theoretical knowledge of algorithms or programming languages.

Your Next Steps in Genomics
Start small but think big. Choose a dataset related to your interests and work through a complete analysis using one of the web-based tools we've discussed. Focus on understanding the biological story your data is telling, not just generating statistical outputs.
As you become comfortable with these analyses, consider learning R or Python to access more sophisticated analysis methods. But remember – the most important skill is biological interpretation, not programming prowess.
The field of genomics is vast and constantly evolving, but the fundamental principles of careful experimental design, rigorous statistical analysis, and thoughtful biological interpretation remain constant. Microarray analysis provides an excellent foundation for developing these core competencies.
Your journey into professional genomics analysis starts with curiosity and a willingness to learn from real data. The tools are available, the data is free, and the opportunities are endless. The only question is: what biological mysteries will you solve first?
Essential Resources for Your Journey
Analysis Platforms:
- ArrayAnalysis.org: Complete web-based microarray suite
- Genealyzer: Intuitive differential expression analysis
- BART: Automated plug-and-play analysis
- GEO2R: Built-in GEO analysis tool
Data Sources:
- GEO Database: https://www.ncbi.nlm.nih.gov/geo/
- ArrayExpress: https://www.ebi.ac.uk/arrayexpress/
Professional Development:
- Bioconductor: https://www.bioconductor.org/
- R Programming: https://www.r-project.org/
The molecular conversations happening in cells worldwide are waiting to be decoded. Your microarray analysis skills are the key to understanding these biological stories and contributing to discoveries that could change medicine, agriculture, and our fundamental understanding of life itself.
Reference
- Gene Expression Omnibus scale overview — ScienceDirect Topics: https://www.sciencedirect.com/topics/medicine-and-dentistry/gene-expression-omnibus (reports ~1.3M samples).
- GEO Accession GSE45827 — NCBI GEO: https://www.ncbi.nlm.nih.gov/geo/query/acc.cgi?acc=GSE45827 (Affymetrix U133 Plus 2.0; 130 breast cancer + 11 normal samples).
- GEO main page — NCBI (MIAME-compliant repository; standardized records & tools): https://www.ncbi.nlm.nih.gov/geo/
-
ArrayExpress: EMBL-EBI functional genomics data repository with advanced search filters. EMBL-EBI Training resources.
https://www.ebi.ac.uk/training/online/courses/functional-genomics-introduction-embl-ebi-resource/functional-genomic-resources-at-embl-ebi/arrayexpress/ -
ArrayExpress in BioStudies: embedding functional genomics datasets with rich metadata. EMBL-EBI Training overview.
https://www.ebi.ac.uk/training/online/courses/methods-and-resources-for-omics-studies/functional-genomics/arrayexpress-biostudies/
Frequently Asked Questions
Founder of BTGenZ. Passionate about simplifying biotechnology for the next generation and bridging the information gap for aspiring biotechnologists in India.

Related Reads
Engage with Our Community
Join the conversation and share your thoughts with the BTGenZ community!
Connect on LinkedInLoading commenting section...
Comments Section
No approved comments yet. Be the first to leave a comment!